Another Casino stock was added this week. As the saying goes, “Know when to hold ’em, know when to fold ’em, know when to walk away, know when to run!” ;-)
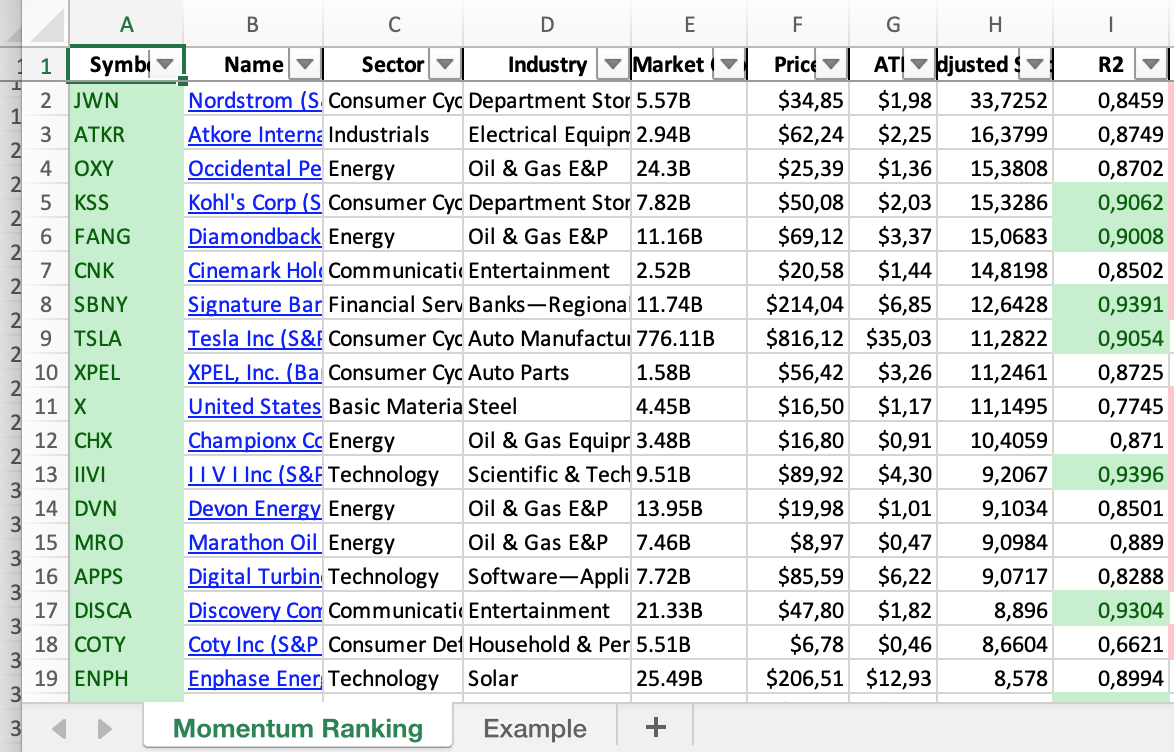
According to the latest ranking the following trades were due this week:
This week’s transactions:
-
Sold:
- MYRG (no longer in top 20%)
-
Reduced to 50% (below the 8/21 MA):
- NCR
- TSLA
-
New Buys:
- PENN (Penn Natl Gaming Inc (S&P 400)))
The S&P 400 still has the biggest share in the portfolio:
pie title Index Distribution
"S&P 400":40.57
"S&P 500":37.71
"Barrons 400":20.12
"Cash":1.59
Current portfolio (@finviz):
| Symbol | Name | Index | Sector | MC | Dist to 52w High | pct |
|---|---|---|---|---|---|---|
| ATKR | Atkore International Group Inc. | Barrons 400 | Industrials | 2.93B | -2.7% | 3.6% |
| UAA | Under Armour, Inc. | S&P 500 | Consumer Cyclical | 9.37B | -4.8% | 3.5% |
| IVZ | Invesco Ltd. | S&P 500 | Financial Services | 10.52B | -2.5% | 3.1% |
| EVR | Evercore Inc. | S&P 400 | Financial Services | 4.77B | -7.2% | 3.1% |
| TPR | Tapestry, Inc. | S&P 500 | Consumer Cyclical | 10.74B | -4.7% | 3.1% |
| PNFP | Pinnacle Financial Partners, Inc. | S&P 400 | Financial Services | 5.94B | -3.5% | 3.0% |
| TBBK | The Bancorp, Inc. | Barrons 400 | Financial Services | 1.17B | -3.8% | 3.0% |
| MAT | Mattel, Inc. | S&P 400 | Consumer Cyclical | 6.53B | -3.7% | 2.9% |
| SIVB | SVB Financial Group | S&P 500 | Financial Services | 27.14B | -3.4% | 2.8% |
| OMF | OneMain Holdings, Inc. | Barrons 400 | Financial Services | 7.19B | -10.6% | 2.8% |
| SLM | SLM Corporation | S&P 400 | Financial Services | 5.59B | -4.6% | 2.8% |
| BYD | Boyd Gaming Corporation | S&P 400 | Consumer Cyclical | 6.12B | -2.8% | 2.7% |
| MTZ | MasTec, Inc. | S&P 400 | Industrials | 6.47B | -1.1% | 2.7% |
| ALRM | Alarm.com Holdings, Inc. | Barrons 400 | Technology | 4.99B | -4.5% | 2.7% |
| AMAT | Applied Materials, Inc. | S&P 500 | Technology | 108.84B | -3.7% | 2.6% |
| OZK | Bank OZK | S&P 400 | Financial Services | 5.14B | -3.0% | 2.6% |
| GE | General Electric Company | S&P 500 | Industrials | 103.68B | -9.4% | 2.6% |
| MU | Micron Technology, Inc. | S&P 500 | Technology | 97.95B | -1.4% | 2.6% |
| AXON | Axon Enterprise, Inc. | S&P 400 | Industrials | 11.36B | -7.9% | 2.5% |
| GM | General Motors Company | S&P 500 | Consumer Cyclical | 77.67B | -6.0% | 2.4% |
| TEX | Terex Corporation | S&P 400 | Industrials | 2.81B | -4.1% | 2.3% |
| APPS | Digital Turbine, Inc. | Barrons 400 | Technology | 7.52B | -12.4% | 2.3% |
| BKR | Baker Hughes Company | S&P 500 | Energy | 24.16B | -5.6% | 2.3% |
| DAR | Darling Ingredients Inc. | S&P 400 | Consumer Defensive | 11.37B | -5.2% | 2.3% |
| AEO | American Eagle Outfitters, Inc. | S&P 400 | Consumer Cyclical | 4.16B | -4.4% | 2.3% |
| DISCA | Discovery, Inc. | S&P 500 | Consumer Cyclical | 21.08B | -4.3% | 2.3% |
| OLN | Olin Corporation | S&P 400 | Basic Materials | 4.62B | -3.0% | 2.3% |
| CROX | Crocs, Inc. | Barrons 400 | Consumer Cyclical | 5.42B | -1.8% | 2.2% |
| GTLS | Chart Industries, Inc. | Barrons 400 | Industrials | 5.62B | -3.4% | 2.1% |
| VIAC | ViacomCBS Inc. | S&P 500 | Communication Services | 36.36B | -4.0% | 2.1% |
| ADNT | Adient plc | S&P 400 | Consumer Cyclical | 3.49B | -3.3% | 2.1% |
| ARWR | Arrowhead Pharmaceuticals, Inc. | S&P 400 | Healthcare | 8.94B | -4.8% | 2.1% |
| CREE | Cree, Inc. | S&P 400 | Technology | 13.41B | -5.3% | 2.0% |
| FCX | Freeport-McMoRan Inc. | S&P 500 | Basic Materials | 47.37B | -8.1% | 1.9% |
| ENPH | Enphase Energy, Inc. | S&P 500 | Technology | 24.65B | -9.8% | 1.7% |
| cash | Cash | Cash | Cash | – | 0.0% | 1.6% |
| PENN | Penn National Gaming, Inc. | S&P 400 | Consumer Cyclical | 18.59B | -7.9% | 1.6% |
| DFS | Discover Financial Services | S&P 500 | Financial Services | 29.01B | -7.2% | 1.5% |
| APA | Apache Corporation | S&P 500 | Energy | 6.96B | -40.2% | 1.5% |
| XPEL | XPEL, Inc. | Barrons 400 | Consumer Cyclical | 1.53B | -7.2% | 1.5% |
| NCR | NCR Corporation | S&P 400 | Technology | 4.49B | -11.1% | 1.1% |
| ALB | Albemarle Corporation | S&P 500 | Basic Materials | 19.08B | -12.6% | 1.0% |
| TSLA | Tesla, Inc. | S&P 500 | Consumer Cyclical | 767.59B | -9.4% | 0.7% |
Current portfolio allocation:
pie title Sector Distribution
"Consumer Cyclical":27.31
"Financial Services":24.66
"Industrials":15.8
"Technology":15.09
"Basic Materials":5.25
"Energy":3.85
"Consumer Defensive":2.25
"Communication Services":2.11
"Healthcare":2.08
"Cash":1.59
As always, more trades next week!