We made 6 new trades this week, consisting of 0 buy(s) and 6 sell(s).
Click here for the Momentum Ranking of week 11.
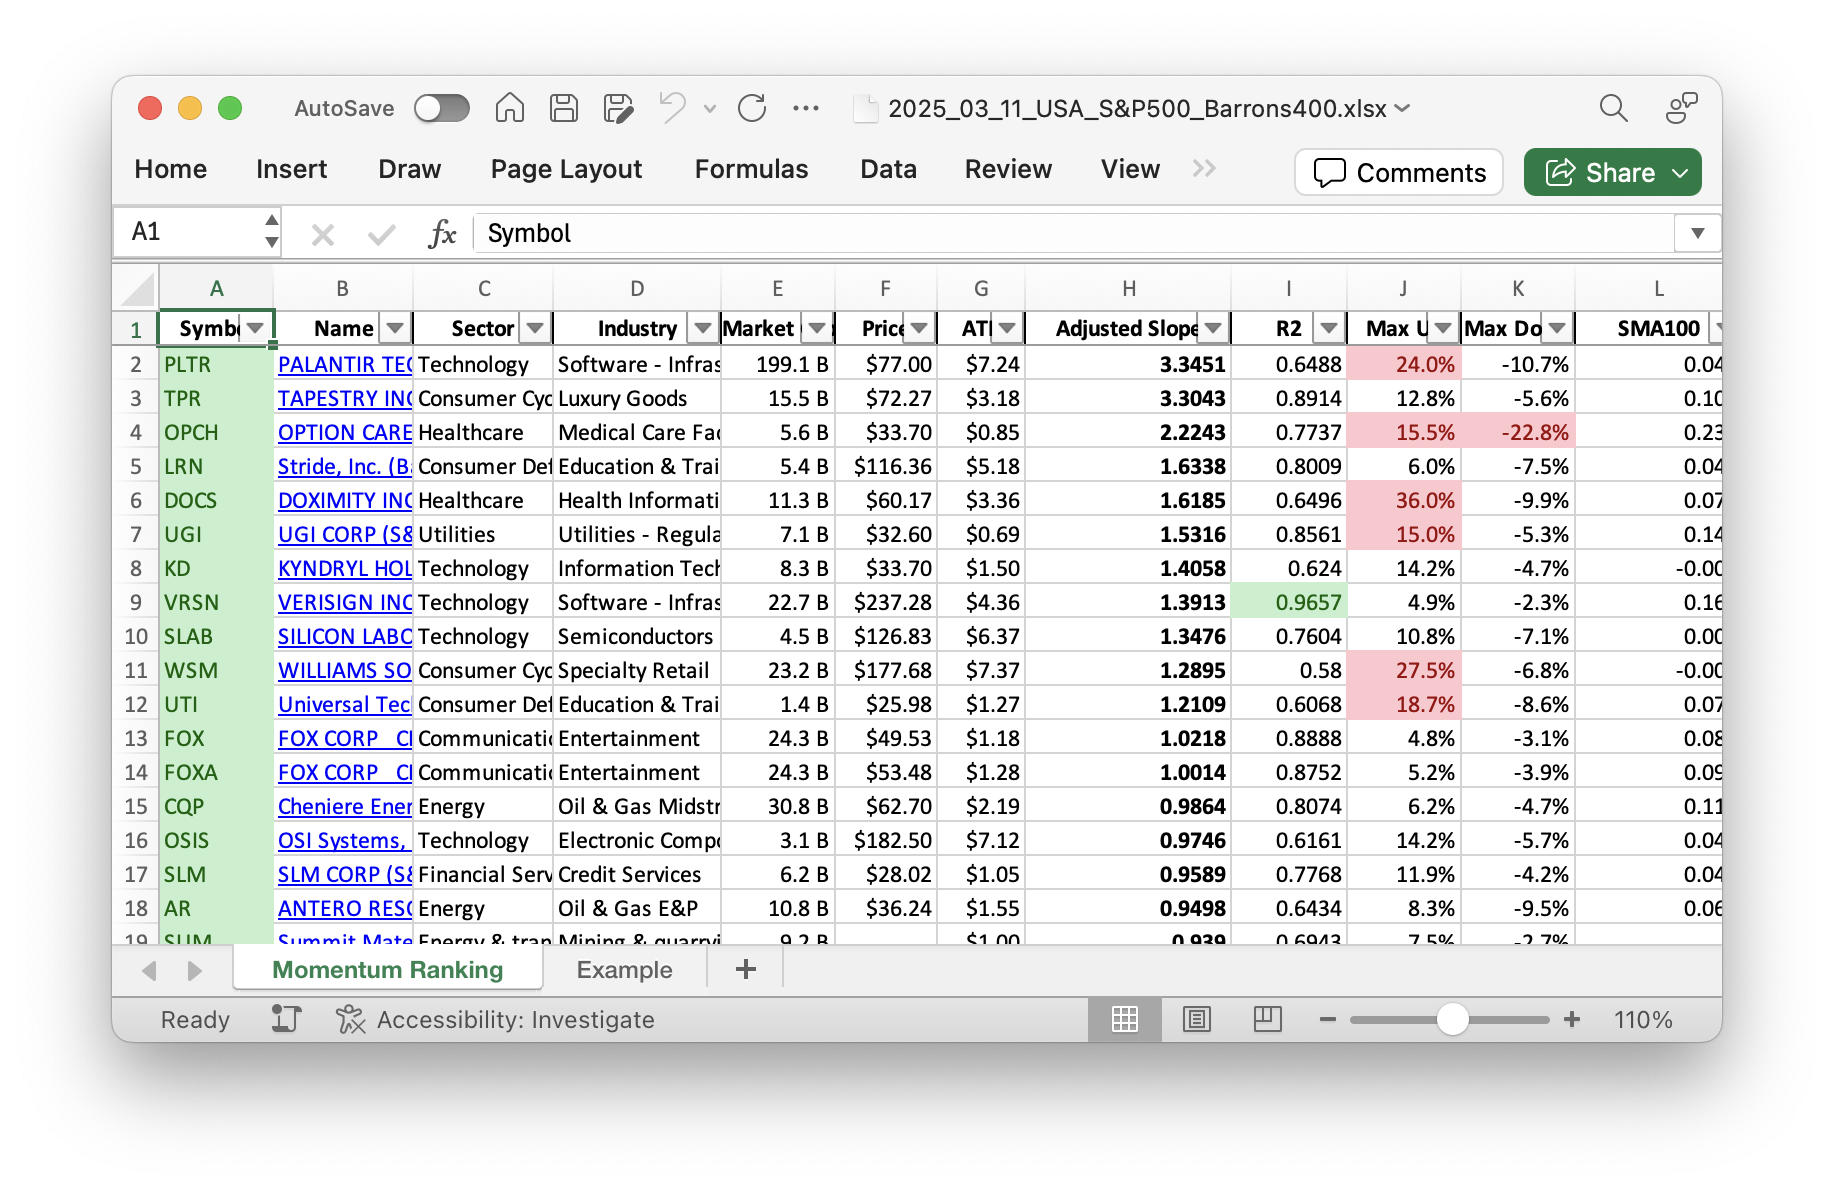
Weekly Trading Overview
Hello traders! This week has been quite a whirlwind in the markets. We’ve seen significant shifts as the S&P 500 closed below its 200-day moving average for the first time in 16 months. That’s a big deal. The market’s current state keeps us cautious, emphasizing the importance of cash reserves. Our strategy, detailed by Andreas Clenow in Stocks On The Move, suggests holding back on new positions unless the S&P 500 trades above its 200-day moving average. Right now, it’s been below for -2 days.
Buys and Sells
No new buys this week. We’re focusing on maintaining our portfolio’s resilience. If you recall from the book, when stock indicators fall, they trigger specific actions. Accordingly, we made significant sell-offs: CORT, IBKR, KD, OPCH, RL, and WSM. These stocks stepped out of the top 10% of our rankings, and rules are rules. Interestingly, the cash position in our portfolio has increased. Holding cash can be strong strategy during uncertain times.
Performance Recap
Now, let’s talk performances. Our best-performing stock was VRSN, gaining modestly with an increase of 0.48%. On the flip side, TPR had a rough week, dropping by 16.86%. It’s all about those ups and downs, right? We’re strategically positioned to navigate through such volatile environments. Our approach to rebalancing has tailored well to current conditions, allowing us to keep a closer eye on market movements.
Summary
In summary, this week was all about adjusting to changing market conditions. With the S&P 500 slipping below its benchmark moving average, our strategy guides us to lean more into cash and less into new stock positions. We believe in staying agile and informed.
Got any thoughts or questions? We’d love to hear from you. Share your comments below!
This week’s transactions:
-
Sold:
-
Bought:
- No buys in this week!
-
Rebalanced / added:
- No positions were added to in this week!
-
Rebalanced / reduced:
- No positions were reduced in this week!
Index Distribution:
Most of our holdings are from the S&P 400 index right now.
Current portfolio allocation:
The portfolio is mostly just cash right now, waiting for some good opportunities:
Weekly sector distribution:
Current portfolio (@finviz):
| Symbol | Name | Index | Sector | MC | Dist to 52w High | pct |
|---|---|---|---|---|---|---|
| cash | Cash | Cash | Cash | – | 11098 | 0.25 |
| UGI | UGI Corp | S&P 400 | Utilities | 6.99B | -5.65% | 0.118 |
| LRN | Stride Inc | Barrons 400 | Consumer Defensive | 5.14B | -18.61% | 0.073 |
| TPR | Tapestry Inc | S&P 500 | Consumer Cyclical | 14.88B | -20.90% | 0.064 |
| OSIS | OSI Systems, Inc | Barrons 400 | Technology | 3.03B | -17.90% | 0.061 |
| TKO | TKO Group Holdings Inc | S&P 400 | Communication Services | 24.53B | -19.99% | 0.061 |
| VRSN | Verisign Inc | S&P 500 | Technology | 22.46B | -1.97% | 0.059 |
| SLAB | Silicon Laboratories Inc | S&P 400 | Technology | 4.08B | -21.43% | 0.048 |
| UTI | Universal Technical Institute Inc | Barrons 400 | Consumer Defensive | 1.41B | -15.24% | 0.047 |
| FOX | Fox Corporation | S&P 500 | Communication Services | 23.33B | -10.02% | 0.046 |
| SLM | SLM Corp | S&P 400 | Financial Services | 5.89B | -14.23% | 0.032 |
| EQT | EQT Corp | S&P 500 | Energy | 29.30B | -13.44% | 0.032 |
| DOCS | Doximity Inc | S&P 400 | Healthcare | 11.40B | -28.67% | 0.031 |
| PEN | Penumbra Inc | S&P 400 | Healthcare | 10.03B | -15.97% | 0.029 |
| PLTR | Palantir Technologies Inc | S&P 500 | Technology | 182.63B | -37.91% | 0.026 |
| AR | Antero Resources Corp | S&P 400 | Energy | 11.12B | -13.95% | 0.022 |
As always, more trades next week!