There was no trading activity to report this week.
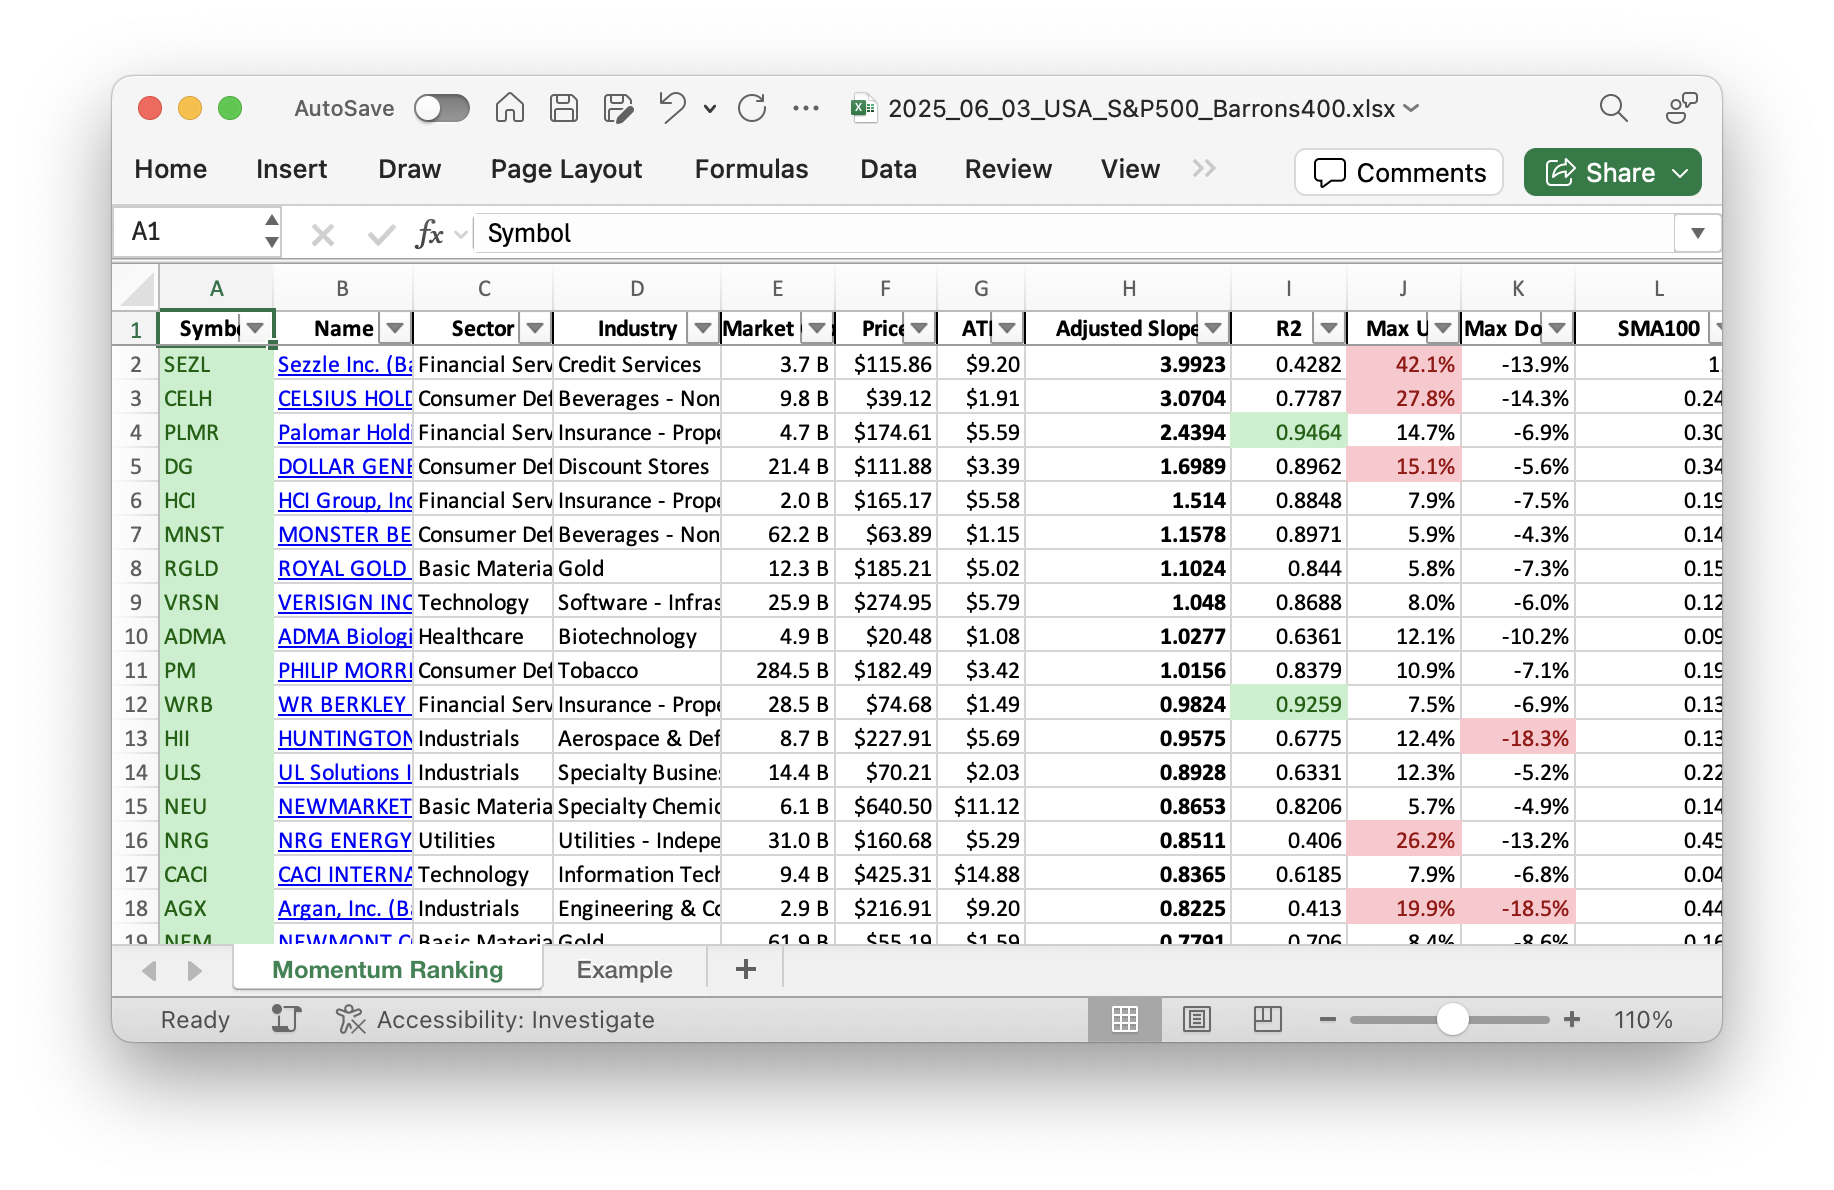
Get ahead of the game with our weekly Momentum Ranking report! Click here to see the top stocks for week 23.
This Week’s Trading Activity: A Snapshot
Hello investors! Let’s dive right into this week’s trading activity, guided by the momentum-based strategy inspired by Andreas Clenow’s “Stocks On The Move”. With the S&P 500 having been above its 200-day moving average for 16 days, our portfolio management rules have been active, yet the market hasn’t spurred many transactions. This week’s market behavior aligns with our disciplined approach.
Portfolio Moves: New Buys and Sells
This week, our actions were pretty limited. We didn’t initiate any new buys. On the sell side, there was also no movement. The absence of trades simply reinforces our commitment to our strategy. We’re closely monitoring the adjusted slope rankings and the 100-day moving average for all stocks in our portfolio. Stay patient and consistent—that’s the key.
In terms of our holdings, the Financial Services sector continues to play a significant role in the portfolio. This sector is vital for diversifying our investment position. With its influence on global economies through banking, insurance, and investment services, it presents opportunities for growth and stability in our investment mix.
Among our top holdings, ROL, CNP, and CME remain significant contributors. They each continue to meet the momentum criteria based on the annualized adjusted slope, indicating their potential to perform well in the current market environment.
Performance Recap and Conclusion
This week, DG emerged as the star performer, showing a remarkable gain of 11.06%. On the flip side, LRN faced a dip, with a loss of 6.84%. Even with these fluctuations, our portfolio is almost fully invested, holding only a small amount of cash. We’re staying on course, adjusting holdings where necessary and ready to seize new opportunities, provided market conditions align with our strategy.
In conclusion, we had a stable week, adhering to our systematic momentum ranking strategy. What are your thoughts on this approach? Share any questions or insights in the comments below—we’d love to hear from you!
This week’s transactions:
-
Sold:
- No sells in this week!
-
Bought:
- No buys in this week!
-
Rebalanced / added:
- No positions were added to in this week!
-
Rebalanced / reduced:
- No positions were reduced in this week!
Index Distribution:
Most of our holdings are from the S&P 500 index right now.
Current portfolio allocation:
We’re heavily invested in the Financial Services sector at the moment.
Weekly sector distribution:
Current portfolio (@finviz):
| Symbol | Name | Index | Sector | MC | Dist to 52w High | pct |
|---|---|---|---|---|---|---|
| ROL | Rollins, Inc | S&P 500 | Consumer Cyclical | 28.27B | -0.48% | 0.053 |
| CNP | Centerpoint Energy Inc | S&P 500 | Utilities | 24.44B | -4.74% | 0.053 |
| CME | CME Group Inc | S&P 500 | Financial Services | 101.73B | -2.92% | 0.053 |
| MNST | Monster Beverage Corp | S&P 500 | Consumer Defensive | 62.41B | -0.71% | 0.053 |
| PM | Philip Morris International Inc | S&P 500 | Consumer Defensive | 283.86B | -0.25% | 0.051 |
| NFG | National Fuel Gas Co | S&P 400 | Energy | 7.56B | 0.23% | 0.05 |
| WRB | W.R. Berkley Corp | S&P 500 | Financial Services | 28.36B | -2.12% | 0.049 |
| UGI | UGI Corp | S&P 400 | Utilities | 7.78B | -0.68% | 0.048 |
| NEU | NewMarket Corp | S&P 400 | Basic Materials | 6.02B | -2.38% | 0.048 |
| EHC | Encompass Health Corp | S&P 400 | Healthcare | 12.25B | -0.47% | 0.048 |
| VRSN | Verisign Inc | S&P 500 | Technology | 25.89B | -4.56% | 0.046 |
| COR | Cencora Inc | S&P 500 | Healthcare | 56.51B | -5.75% | 0.044 |
| MCK | Mckesson Corporation | S&P 500 | Healthcare | 89.44B | -2.21% | 0.04 |
| DG | Dollar General Corp | S&P 500 | Consumer Defensive | 24.76B | -20.30% | 0.038 |
| PLTR | Palantir Technologies Inc | S&P 500 | Technology | 314.27B | -0.97% | 0.037 |
| FCFS | FirstCash Holdings Inc | S&P 400 | Financial Services | 5.61B | -6.65% | 0.035 |
| RGLD | Royal Gold, Inc | S&P 400 | Basic Materials | 12.20B | -3.34% | 0.035 |
| HII | Huntington Ingalls Industries Inc | S&P 500 | Industrials | 8.94B | -20.24% | 0.034 |
| NEM | Newmont Corp | S&P 500 | Basic Materials | 61.59B | -5.76% | 0.033 |
| ULS | UL Solutions Inc | Barrons 400 | Industrials | 14.05B | -3.72% | 0.033 |
| PLMR | Palomar Holdings Inc | Barrons 400 | Financial Services | 4.68B | -0.39% | 0.029 |
| LRN | Stride Inc | Barrons 400 | Consumer Defensive | 6.20B | -12.17% | 0.027 |
| OSIS | OSI Systems, Inc | Barrons 400 | Technology | 3.71B | -5.72% | 0.025 |
| HCI | HCI Group Inc | Barrons 400 | Financial Services | 1.91B | -6.43% | 0.019 |
| ADMA | Adma Biologics Inc | Barrons 400 | Healthcare | 4.88B | -20.30% | 0.017 |
| cash | Cash | Cash | Cash | – | 124 | 0.002 |
As always, more trades next week!