This week was quiet on the trading front - no new buys or sells.
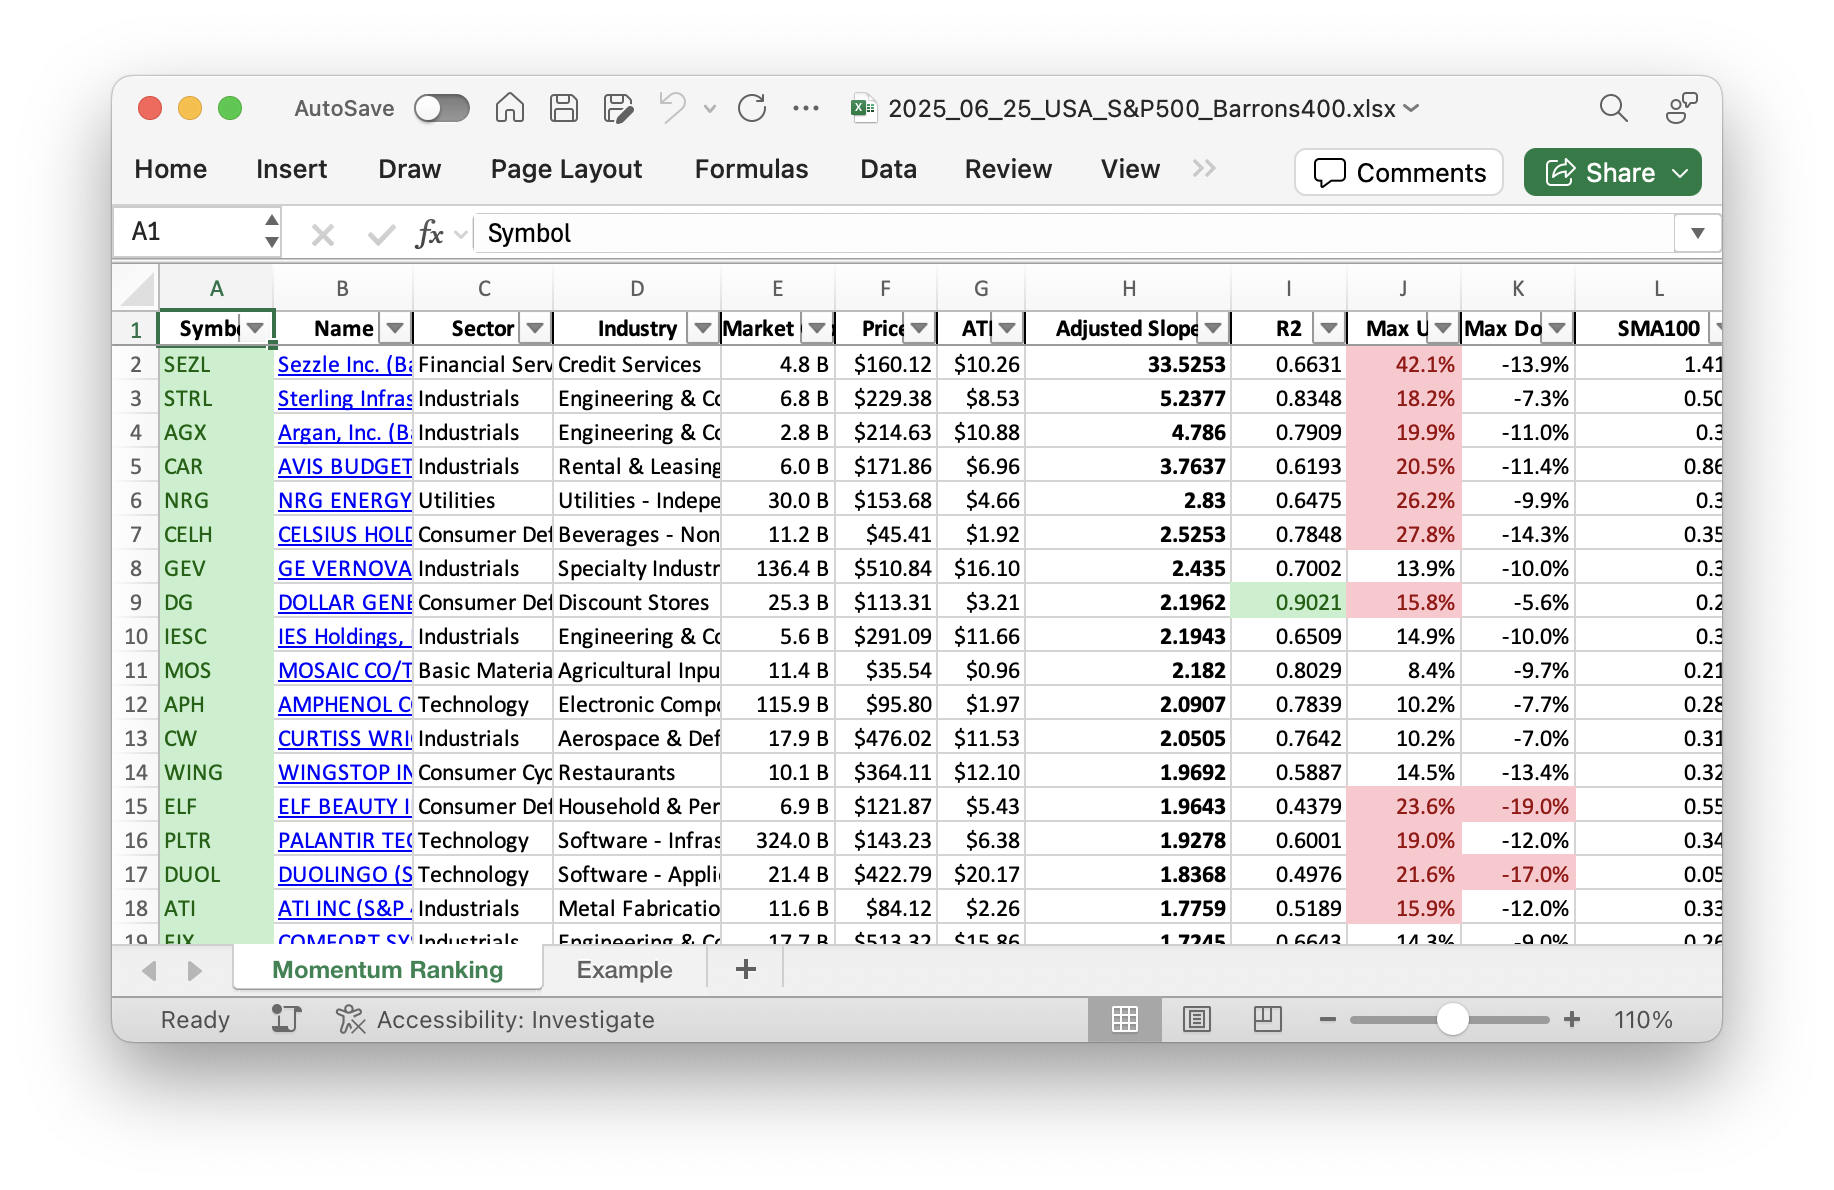
Click here for the Momentum Ranking of week 26.
Navigating the Week: Market Updates and Portfolio Movements
Hello investors, and welcome to this week’s portfolio update! The market spotlight shines as the S&P 500 remains 31 days above its 200-day moving average. This is a positive regime indicating potential market stability according to our method outlined by Andreas Clenow in ‘Stocks On The Move’. With just over 1% of our portfolio in cash, we’re almost fully invested.
Buys & Sells: A Quiet Week
This week, there were no new buys or sells made in our portfolio. Occasionally, it’s wise to simply hold steady, and this week was one of those times. As our strategy dictates, we continue to monitor the top performers based on the annualized adjusted slope, waiting for optimal opportunities dictated by both our momentum ranking and the S&P 500’s position relative to its 200-day moving average.
Portfolio Insights: Consumer Defensive Stands Out
Our portfolio’s top sector is Consumer Defensive, a strategic anchor providing resilience against market fluctuations. Top holdings in this space include MNST, PM, and NEU, showcasing our commitment to robust, stable performers. This week, STRL took center stage as the best performer with an impressive gain of 13%, whereas OSIS was the weakest link, dropping by 6.67%.
As always, we encourage you to share your thoughts in the comments section below. What’s your perspective on the market’s current trajectory? We’d love to hear from you!
This week’s transactions:
-
Sold:
- No sells in this week!
-
Bought:
- No buys in this week!
-
Rebalanced / added:
- No positions were added to in this week!
-
Rebalanced / reduced:
- No positions were reduced in this week!
Index Distribution:
The majority of our portfolio is currently made up of stocks from the S&P 500 sector.
Current portfolio allocation:
Our portfolio is currently dominated by the Consumer Defensive sector.
Weekly sector distribution:
Current portfolio (@finviz):
| Symbol | Name | Index | Sector | MC | Dist to 52w High | pct |
|---|---|---|---|---|---|---|
| MNST | Monster Beverage Corp | S&P 500 | Consumer Defensive | 62.00B | -1.37% | 0.052 |
| PM | Philip Morris International Inc | S&P 500 | Consumer Defensive | 287.16B | -1.18% | 0.052 |
| NEU | NewMarket Corp | S&P 400 | Basic Materials | 6.47B | 1.28% | 0.051 |
| NFG | National Fuel Gas Co | S&P 400 | Energy | 7.72B | -1.16% | 0.051 |
| UGI | UGI Corp | S&P 400 | Utilities | 7.82B | -0.35% | 0.048 |
| VRSN | Verisign Inc | S&P 500 | Technology | 26.76B | -1.36% | 0.048 |
| WRB | W.R. Berkley Corp | S&P 500 | Financial Services | 27.80B | -3.42% | 0.048 |
| EHC | Encompass Health Corp | S&P 400 | Healthcare | 12.19B | -1.79% | 0.047 |
| COR | Cencora Inc | S&P 500 | Healthcare | 57.01B | -4.92% | 0.044 |
| MCK | Mckesson Corporation | S&P 500 | Healthcare | 90.03B | -1.67% | 0.04 |
| PLTR | Palantir Technologies Inc | S&P 500 | Technology | 338.01B | -1.13% | 0.04 |
| DG | Dollar General Corp | S&P 500 | Consumer Defensive | 24.94B | -16.35% | 0.038 |
| FCFS | FirstCash Holdings Inc | S&P 400 | Financial Services | 5.79B | -3.74% | 0.037 |
| MOS | Mosaic Company | S&P 500 | Basic Materials | 11.27B | -5.70% | 0.035 |
| NEM | Newmont Corp | S&P 500 | Basic Materials | 64.65B | -3.68% | 0.035 |
| HII | Huntington Ingalls Industries Inc | S&P 500 | Industrials | 9.09B | -18.96% | 0.035 |
| ULS | UL Solutions Inc | Barrons 400 | Industrials | 14.62B | 0.14% | 0.034 |
| RGLD | Royal Gold, Inc | S&P 400 | Basic Materials | 11.72B | -7.11% | 0.033 |
| ROL | Rollins, Inc | S&P 500 | Consumer Cyclical | 27.88B | -1.93% | 0.031 |
| CNP | Centerpoint Energy Inc | S&P 500 | Utilities | 23.81B | -7.19% | 0.029 |
| LRN | Stride Inc | Barrons 400 | Consumer Defensive | 6.29B | -10.94% | 0.027 |
| PLMR | Palomar Holdings Inc | Barrons 400 | Financial Services | 4.28B | -9.00% | 0.027 |
| STRL | Sterling Infrastructure Inc | Barrons 400 | Industrials | 6.98B | -1.79% | 0.026 |
| CME | CME Group Inc | S&P 500 | Financial Services | 97.79B | -6.67% | 0.025 |
| OSIS | OSI Systems, Inc | Barrons 400 | Technology | 3.60B | -11.34% | 0.024 |
| HCI | HCI Group Inc | Barrons 400 | Financial Services | 1.72B | -15.33% | 0.017 |
| AGX | Argan, Inc | Barrons 400 | Industrials | 2.93B | -12.96% | 0.016 |
| cash | Cash | Cash | Cash | – | 566 | 0.011 |
As always, more trades next week!