This week, we executed 1 new trades, including 0 buy(s) and 1 sell(s).
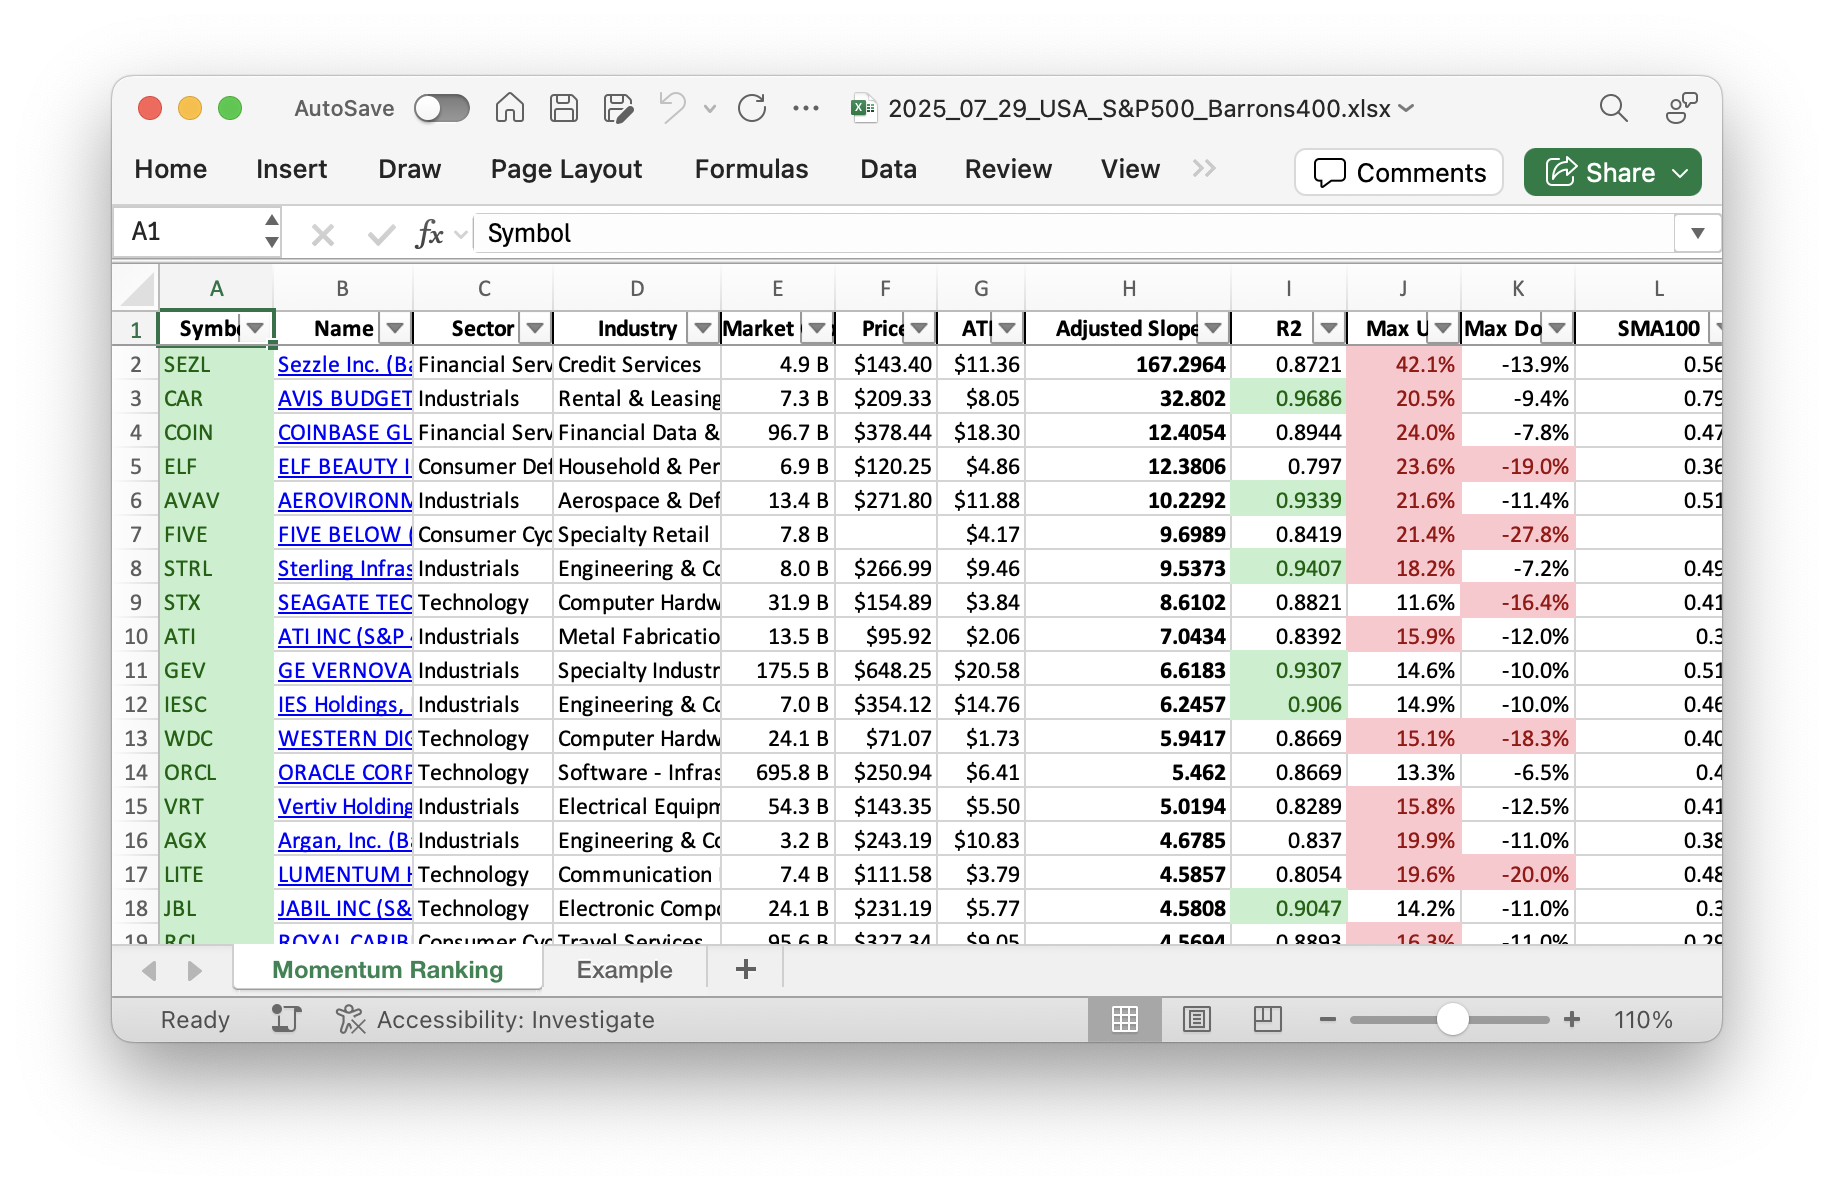
Looking for reliable stock performance data? Check out our weekly Momentum Ranking (based on Andreas Clenow’s book Stocks on the Move), updated every week with the latest figures! Click here to see the report for week 31.
Weekly Portfolio Update: A Glimpse into Our Momentum Strategy
This week marks a notable period, as the S&P 500 has remained above its 200-day moving average for 51 days, signaling a positive market regime. We are almost fully invested with only a small cash share of around 2.25%, reflecting our confidence in the current market conditions.
In this week’s trades, we sold NEM as it no longer ranks in the top tier of our momentum strategy according to the annualized adjusted slope methodology, as detailed by Andreas Clenow in ‘Stocks On The Move’. For those unfamiliar, Clenow’s approach involves ranking stocks by their momentum and making trades based on strategic thresholds.
We added to our existing positions in HII, ORCL, PLTR, and ULS, reinforcing our confidence in these stocks’ momentum journey. Meanwhile, we strategically trimmed our positions in FIX and GEV to keep our portfolio aligned with our momentum ranking.
In summary, Industrials emerge as our top-performing sector this week, renowned for its robust growth potential and resilience in diverse market cycles. Our top holdings currently are NEU, HII, and ULS, each bringing its unique strengths to our portfolio. Among performance standouts, FIX shines brightest with an impressive gain of over 25%, while NEU faced a slight setback at approximately -4.79%.
Got thoughts on this week’s portfolio adjustments or the momentum strategy? Feel free to share in the comments below!
This week’s transactions:
-
Sold:
-
Bought:
- No buys in this week!
-
Rebalanced / added:
-
Rebalanced / reduced:
Index Distribution:
The S&P 500 sector is where most of our investments are right now.
Current portfolio allocation:
We’re heavily invested in the Industrials sector at the moment.
Weekly sector distribution:
Current portfolio (@finviz):
| Symbol | Name | Index | Sector | MC | Dist to 52w High | pct |
|---|---|---|---|---|---|---|
| NEU | NewMarket Corp | S&P 400 | Basic Materials | 6.54B | -6.71% | 0.101 |
| HII | Huntington Ingalls Industries Inc | S&P 500 | Industrials | 10.32B | -7.98% | 0.095 |
| ULS | UL Solutions Inc | Barrons 400 | Industrials | 14.28B | -3.74% | 0.09 |
| ATI | ATI Inc | S&P 400 | Industrials | 13.47B | -0.72% | 0.086 |
| JBL | Jabil Inc | S&P 500 | Technology | 24.93B | 1.36% | 0.081 |
| ORCL | Oracle Corp | S&P 500 | Technology | 703.55B | -0.45% | 0.076 |
| MOS | Mosaic Company | S&P 500 | Basic Materials | 11.56B | -4.68% | 0.075 |
| GEV | GE Vernova Inc | S&P 500 | Industrials | 174.85B | -1.37% | 0.059 |
| STRL | Sterling Infrastructure Inc | Barrons 400 | Industrials | 8.11B | -1.31% | 0.052 |
| IESC | IES Holdings Inc | Barrons 400 | Industrials | 7.03B | -4.58% | 0.051 |
| FIX | Comfort Systems USA, Inc | S&P 400 | Industrials | 24.56B | -1.88% | 0.05 |
| VST | Vistra Corp | S&P 500 | Utilities | 67.26B | -4.29% | 0.046 |
| PLTR | Palantir Technologies Inc | S&P 500 | Technology | 371.96B | -1.73% | 0.04 |
| AGX | Argan, Inc | Barrons 400 | Industrials | 3.32B | -1.39% | 0.039 |
| DG | Dollar General Corp | S&P 500 | Consumer Defensive | 23.38B | -16.32% | 0.036 |
| cash | Cash | Cash | Cash | – | - | 0.023 |
As always, more trades next week!