In this week, there were 5 new trades: 3 buy(s) and 2 sell(s).
Discover the top-performing stocks of the week with our Momentum Ranking! Click here to access the latest data for week 42.
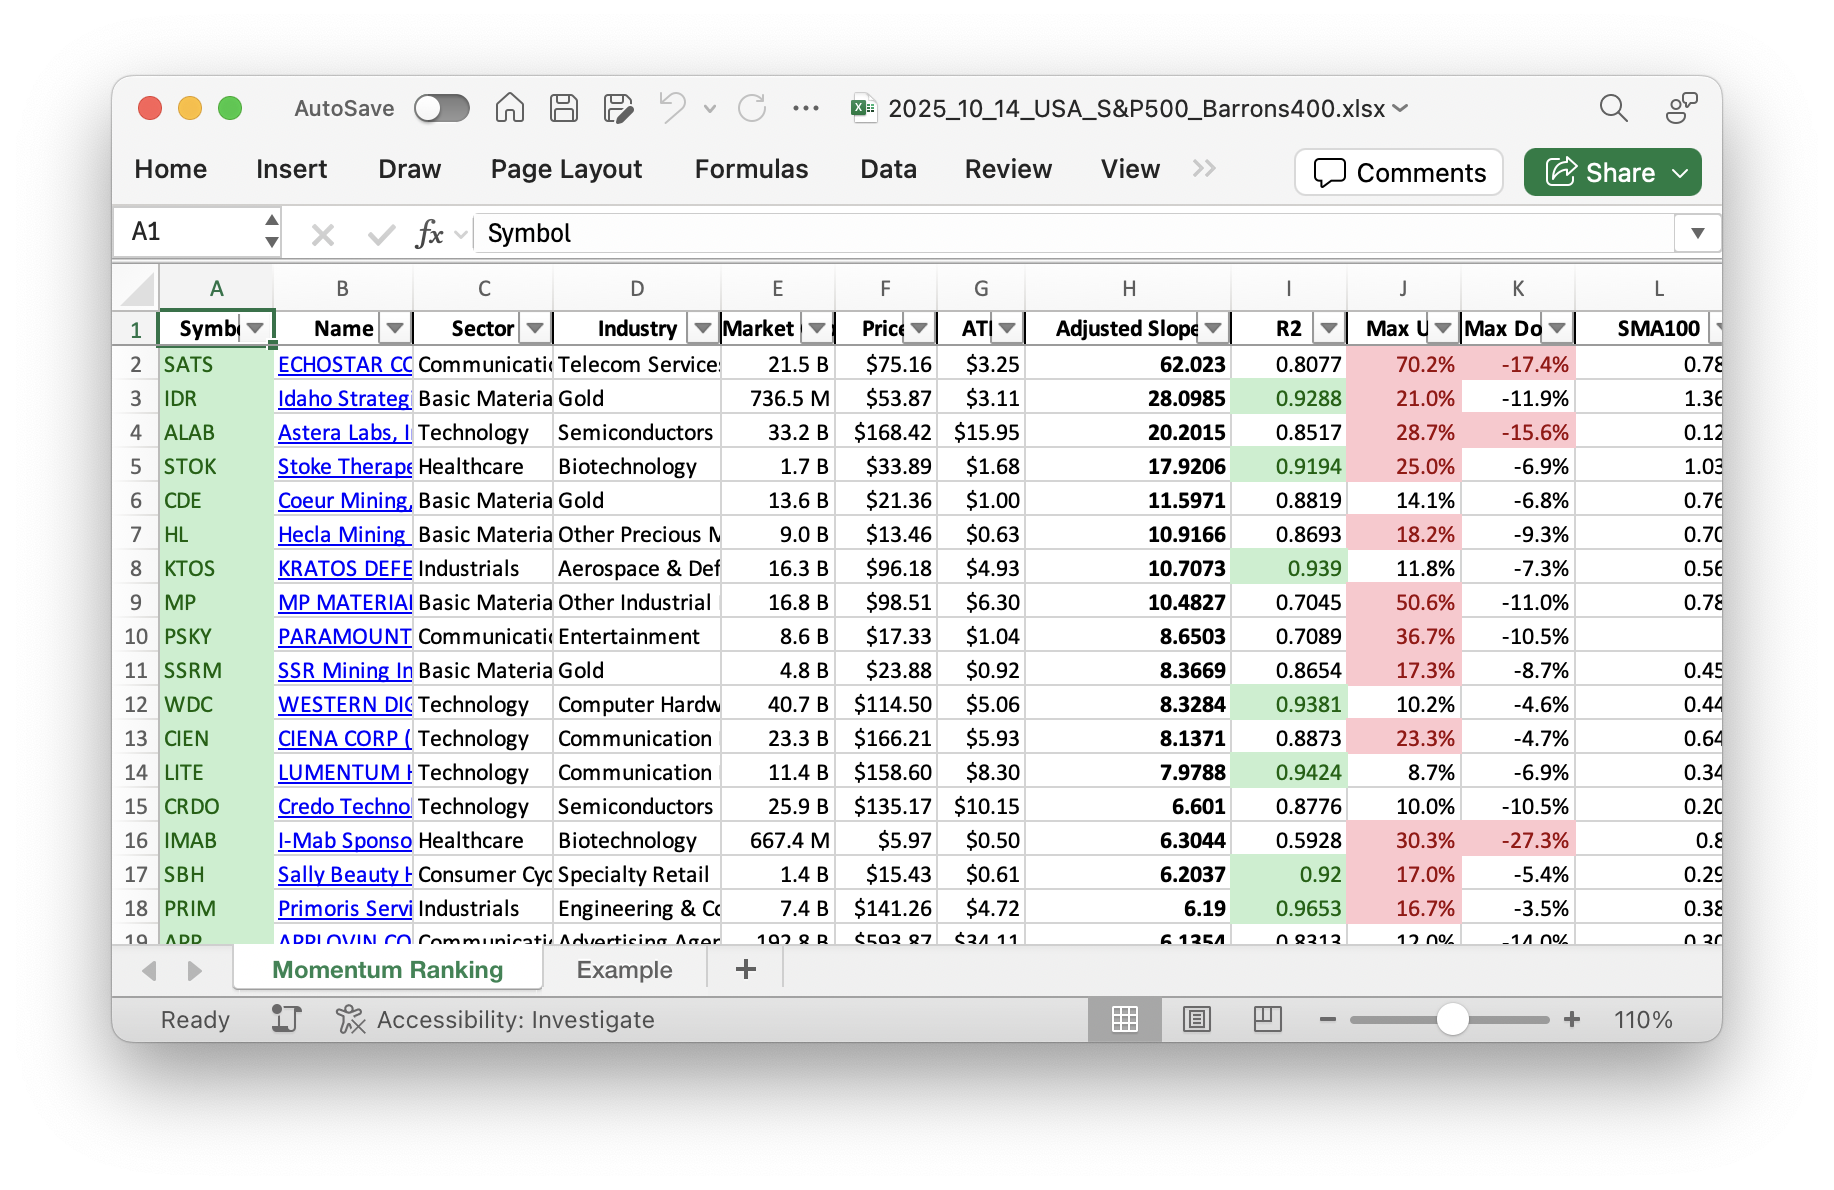
Market Tone and Portfolio Overview
This week, the market has remained optimistic as the S&P 500 has been trading above its 200-day moving average for an impressive 108 days. We’re nearly fully invested, indicated by our minimal cash position of -0.25%. Given the market’s momentum, we continue to take strategic actions within our portfolio.
Trading Activity
We introduced three new stocks to our portfolio. CIENA Corp. (CIEN), a key player in the technology sector, was added due to its strong upward trend. Sally Beauty Holdings (SBH), in the consumer sector, was included for its potential despite a recent dip, and SSR Mining (SSRM), from the materials sector, aims to diversify our holdings.
Turning to sales, both ALAB Technologies (ALAB), which faced significant losses, and NVIDIA (NVDA), no longer in the top rankings, were sold. We also added to our existing position in Western Digital Corp. (WDC), recognizing its continued value. Meanwhile, we trimmed our holdings in FLEX, MEDP, and STOK as part of our regular rebalancing strategy.
Portfolio Highlights
Our portfolio continues to showcase the Technology sector as our top sector, often playing a vital role in driving growth and innovation. However, our top holdings, FLEX, MEDP, and FIX, span diverse sectors to balance risk. Notably, MP Materials (MP) emerged as our best performer with an impressive rise of over 32.95%. On the contrary, Sally Beauty Holdings (SBH) was the worst performer this week, showing a decline of 12.65%.
Nearly fully invested, our strategy ensures we’re capturing market opportunities efficiently. Are there any stocks or sectors you think we’re missing out on? Share your thoughts in the comments below.
This week’s transactions:
Index Distribution:
We’re mainly invested in stocks from the S&P 400 group at the moment.
Current portfolio allocation:
Our portfolio is heavily invested in the Technology sector right now.
Weekly sector distribution:
Current portfolio (@finviz):
| Symbol | Name | Index | Sector | MC | Dist to 52w High | pct |
|---|---|---|---|---|---|---|
| FLEX | Flex Ltd | S&P 400 | Technology | 22.60B | 0.29% | 0.062 |
| MEDP | Medpace Holdings Inc | S&P 400 | Healthcare | 14.50B | -5.68% | 0.061 |
| FIX | Comfort Systems USA, Inc | S&P 400 | Industrials | 29.60B | -2.66% | 0.056 |
| AVGO | Broadcom Inc | S&P 500 | Technology | 1641.16B | -7.13% | 0.053 |
| SSRM | SSR Mining Inc | Barrons 400 | Basic Materials | 4.85B | -4.76% | 0.052 |
| WDC | Western Digital Corp | S&P 500 | Technology | 39.22B | -16.72% | 0.047 |
| AMD | Advanced Micro Devices Inc | S&P 500 | Technology | 361.40B | -7.25% | 0.047 |
| FN | Fabrinet | S&P 400 | Technology | 13.52B | -4.74% | 0.044 |
| PLTR | Palantir Technologies Inc | S&P 500 | Technology | 431.40B | -4.29% | 0.044 |
| CDE | Coeur Mining Inc | Barrons 400 | Basic Materials | 13.65B | -2.55% | 0.043 |
| STRL | Sterling Infrastructure Inc | Barrons 400 | Industrials | 11.09B | -3.25% | 0.041 |
| CIEN | CIENA Corp | S&P 400 | Technology | 23.39B | -0.89% | 0.041 |
| ORCL | Oracle Corp | S&P 500 | Technology | 856.85B | -12.78% | 0.041 |
| HL | Hecla Mining Co | Barrons 400 | Basic Materials | 8.99B | -3.03% | 0.04 |
| IESC | IES Holdings Inc | Barrons 400 | Industrials | 7.88B | -1.96% | 0.039 |
| KTOS | Kratos Defense & Security Solutions Inc | S&P 400 | Industrials | 16.21B | -14.69% | 0.038 |
| LITE | Lumentum Holdings Inc | S&P 400 | Technology | 11.11B | -10.95% | 0.035 |
| SBH | Sally Beauty Holdings Inc | Barrons 400 | Consumer Cyclical | 1.53B | -8.32% | 0.034 |
| MP | MP Materials Corporation | S&P 400 | Basic Materials | 17.42B | -0.62% | 0.03 |
| SATS | EchoStar Corp | S&P 400 | Communication Services | 21.61B | -12.02% | 0.03 |
| STOK | Stoke Therapeutics Inc | Barrons 400 | Healthcare | 1.86B | 4.69% | 0.027 |
| RDDT | Reddit Inc | Barrons 400 | Communication Services | 36.96B | -30.21% | 0.027 |
| WLDN | Willdan Group Inc | Barrons 400 | Industrials | 1.39B | -21.88% | 0.026 |
| PSKY | Paramount Skydance Corp | S&P 500 | Communication Services | 18.45B | -16.95% | 0.025 |
| PSIX | Power Solutions International Inc | Barrons 400 | Industrials | 2.14B | -23.58% | 0.019 |
| cash | Cash | Cash | Cash | – | - | -0.002 |
As always, more trades next week!