This week, we engaged in 1 new trades, with 0 buy(s) and 1 sell(s).
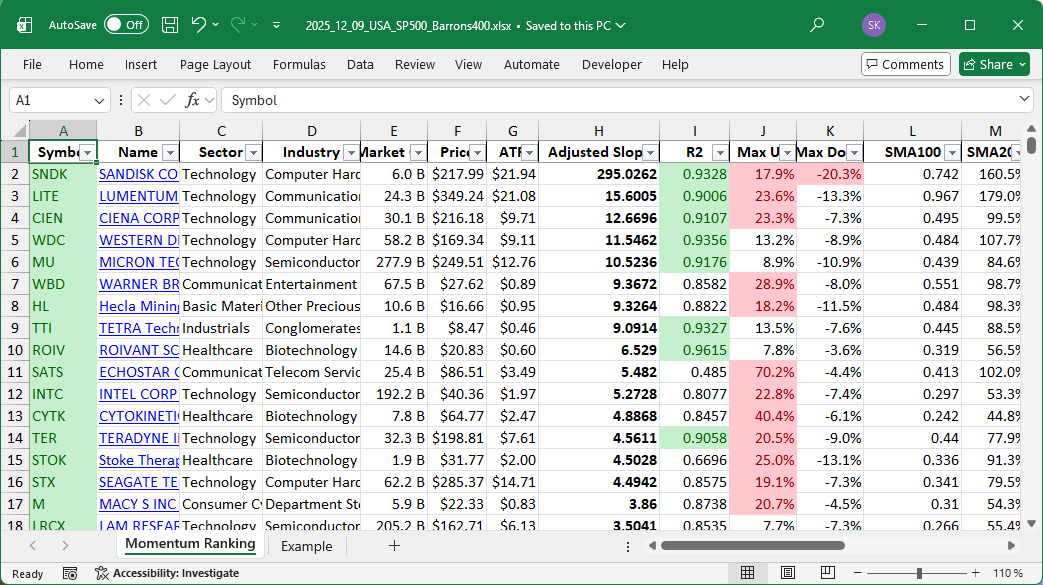
Click here for the Momentum Ranking of week 50.
Weekly Portfolio Update: Navigating Market Nuances
This week has had a mix of challenges and opportunities for investors, as we continue to observe the S&P 500 hovering below the critical 200-day moving avrage for 147 days. Despite this, our portfolio strategy, inspired by Andreas Clenow’s ‘Stocks On The Move’, focuses on maintaining momentum-driven decisions. Currently, our portfolio’s cash position is minimal (-0.056940088869628425%), indicating that we are almost fully invested even as market dynamics influence decision-making.
Trades and Adjustments
In terms of transactions, there were no new positions opened this week due to the S&P 500’s prolonged below-regime status. We closed out our position in SBH, steadfast in our commitment to invest in only top-performing stocks. For those stocks that continue to show promise, we added to our existing positions in CYTK and IDCC. On the other hand, we reduced our position in WBD to optimize our portfolio’s balance and momentum.
Portfolio Performance and Sector Focus
Technology remains the top-performing sector in our portfolio, a testament to its continual role as a driver of innovation and growth. While each sector has its strengths, tech typically leads the charge with rapid advancements and market demand. Our leading holdings include TER, ROIV, and AVGO, reflecting a diverse but focused strategy. From our performance chart, SATS emerged as the best performer soaring by over 20%. Conversely, SSRM didn’t fare as well, being our worst performer with a dip of nearly 10%.
As we navigate these volatile times, we’re eager to hear your thoughts and engage in discussions about market strategies. Please feel free to share your insights in the comments below.
This week’s transactions:
Index Distribution:
Our portfolio is currently dominated by stocks from the S&P 400 index.
Current portfolio allocation:
The Technology sector now has the largest share in the portfolio:
Weekly sector distribution:
Current portfolio (@finviz):
| Symbol | Name | Index | Sector | MC | Dist to 52w High | pct |
|---|---|---|---|---|---|---|
| TER | Teradyne, Inc | S&P 500 | Technology | 31.58B | -1.64% | 0.062 |
| ROIV | Roivant Sciences Ltd | S&P 400 | Healthcare | 14.45B | -3.28% | 0.061 |
| AVGO | Broadcom Inc | S&P 500 | Technology | 1905.36B | -0.94% | 0.056 |
| SATS | EchoStar Corp | S&P 400 | Communication Services | 25.14B | -3.37% | 0.054 |
| FN | Fabrinet | S&P 400 | Technology | 17.78B | -0.35% | 0.053 |
| CYTK | Cytokinetics Inc | S&P 400 | Healthcare | 7.73B | -8.78% | 0.051 |
| CIEN | CIENA Corp | S&P 400 | Technology | 30.70B | 1.62% | 0.049 |
| FIX | Comfort Systems USA, Inc | S&P 400 | Industrials | 35.09B | -4.02% | 0.046 |
| WBD | Warner Bros. Discovery Inc | S&P 500 | Communication Services | 68.44B | -1.94% | 0.046 |
| IDCC | Interdigital Inc | Barrons 400 | Technology | 9.26B | -12.79% | 0.044 |
| INTC | Intel Corp | S&P 500 | Technology | 192.95B | -8.11% | 0.043 |
| IESC | IES Holdings Inc | Barrons 400 | Industrials | 8.97B | 0.29% | 0.041 |
| WDC | Western Digital Corp | S&P 500 | Technology | 58.44B | -4.22% | 0.039 |
| MU | Micron Technology Inc | S&P 500 | Technology | 285.82B | -2.53% | 0.034 |
| TTI | Tetra Technologies, Inc | Barrons 400 | Industrials | 1.14B | -4.98% | 0.032 |
| APP | Applovin Corp | S&P 500 | Communication Services | 241.34B | -4.22% | 0.032 |
| POWL | Powell Industries, Inc | Barrons 400 | Industrials | 4.24B | -15.13% | 0.032 |
| LITE | Lumentum Holdings Inc | S&P 400 | Technology | 25.40B | 3.62% | 0.032 |
| STOK | Stoke Therapeutics Inc | Barrons 400 | Healthcare | 1.84B | -16.63% | 0.027 |
| HL | Hecla Mining Co | Barrons 400 | Basic Materials | 11.45B | -5.71% | 0.027 |
| AMD | Advanced Micro Devices Inc | S&P 500 | Technology | 362.14B | -16.71% | 0.027 |
| STX | Seagate Technology Holdings Plc | S&P 500 | Technology | 61.48B | -3.36% | 0.026 |
| MEDP | Medpace Holdings Inc | S&P 400 | Healthcare | 15.33B | -13.12% | 0.025 |
| FLEX | Flex Ltd | S&P 400 | Technology | 25.66B | 0.22% | 0.023 |
| STRL | Sterling Infrastructure Inc | S&P 400 | Industrials | 10.04B | -22.00% | 0.02 |
| SSRM | SSR Mining Inc | Barrons 400 | Basic Materials | 4.44B | -15.78% | 0.017 |
| cash | Cash | Cash | Cash | – | - | -0.001 |
As always, more trades next week!