Over the course of the week, we made 2 new trades — 1 buy and 1 sell.
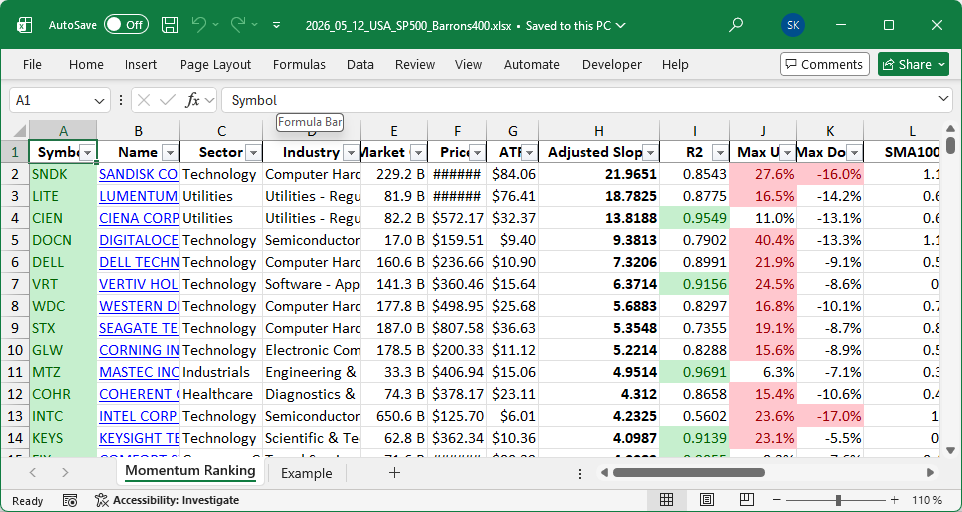
Get ahead of the game with our weekly Momentum Ranking report! Click here to see the top stocks for week 20.
A Volatile Week in Trading: Portfolio Update
This week, we’ve seen quite a bit of movement in the market. The S&P 500 has been climbing above its 200-day moving average for 26 days, which keeps us in “buy mode” based on the momentum-based strategy detailed in Andreas Clenow’s book, Stocks On The Move. By the way, don’t let us being almost fully invested with a modest cash share of 0.5% fool you; we’re still very much in the action!
In terms of our trading activity, we initiated a position in CHRD. Known in the energy sector, this company specializes in oil exploration. Meanwhile, we decided to sell WLK, a player in the chemical manufacturing sector, to streamline our holdings with our strategy’s top-ranking stocks.
Technology is leading the charge as our top sector, playing a critical role in driving portfolio growth thanks to its innovation and market demand. Some of the top names we focus on in technology include KEYS and MTSI. Meanwhile, our top holdings at the moment are KEYS, MTSI, and ATI. This week, DOCN stood out with an impressive 58.3% gain, GLW followed with a 31.0% rise, and MTSI added 28.7%. On the other hand, not every stock had such a boost—APA dropped by 8.5%, with VAL and DOW also seeing downturns. Overall, our portfolio delivered a weekly return of 10.39%, notably outpacing the SPY’s 2.37% for the same period.
Our model is currently eyeing top-ranked stocks such as A, AA, AAL, AAON, and AAPL—these are potential candidates for strengthening our portfolio in the coming weeks. Feel free to drop your thoughts or questions in the comments below!
This week’s transactions:
-
Sold:
-
Bought:
-
Rebalanced / added:
- No positions were added to in this week!
-
Rebalanced / reduced:
- No positions were reduced in this week!
Index Distribution:
Our biggest stock holdings at the moment are in the S&P 500 category.
Current portfolio allocation:
Our portfolio is currently dominated by the Technology sector.
Weekly sector distribution:
Current portfolio (@finviz):
| Symbol | Name | Index | Sector | MC | Dist to 52w High | pct |
|---|---|---|---|---|---|---|
| KEYS | Keysight Technologies Inc | S&P 500 | Technology | 61.84B | -2.59% | 0.066 |
| MTSI | MACOM Technology Solutions Holdings Inc | S&P 400 | Technology | 26.94B | -4.31% | 0.065 |
| ATI | ATI Inc | S&P 400 | Industrials | 22.12B | -5.28% | 0.062 |
| FIX | Comfort Systems USA Inc | S&P 500 | Consumer Cyclical | 71.10B | -1.24% | 0.061 |
| CIEN | CIENA Corp | S&P 500 | Utilities | 80.58B | -3.90% | 0.058 |
| ROIV | Roivant Sciences Ltd | S&P 400 | Healthcare | 20.99B | -3.30% | 0.055 |
| MTZ | Mastec Inc | S&P 400 | Industrials | 33.26B | -4.65% | 0.054 |
| WDC | Western Digital Corp | S&P 500 | Technology | 166.06B | -8.26% | 0.051 |
| STX | Seagate Technology Holdings Plc | S&P 500 | Technology | 180.16B | -4.50% | 0.05 |
| AMAT | Applied Materials Inc | S&P 500 | Technology | 339.71B | -4.55% | 0.049 |
| DAR | Darling Ingredients Inc | S&P 400 | Consumer Defensive | 10.31B | -1.78% | 0.044 |
| GLW | Corning Inc | S&P 500 | Technology | 169.51B | -5.73% | 0.041 |
| TTMI | TTM Technologies Inc | S&P 400 | Technology | 16.56B | -11.43% | 0.041 |
| VAL | Valaris Ltd | S&P 400 | Energy | 6.69B | -8.30% | 0.04 |
| DOW | Dow Inc | S&P 500 | Basic Materials | 28.51B | -7.45% | 0.038 |
| MKSI | MKS Inc | S&P 400 | Technology | 20.78B | -5.88% | 0.038 |
| APA | APA Corp | S&P 500 | Energy | 13.17B | -18.40% | 0.038 |
| CHRD | Chord Energy Corp | S&P 400 | Energy | 8.05B | -4.96% | 0.035 |
| DOCN | DigitalOcean Holdings Inc | S&P 400 | Technology | 16.16B | -6.00% | 0.029 |
| LRCX | Lam Research Corp | S&P 500 | Technology | 358.99B | -4.31% | 0.026 |
| LYB | LyondellBasell Industries NV | S&P 500 | Basic Materials | 24.03B | -11.29% | 0.018 |
| COHR | Coherent Corp | S&P 500 | Healthcare | 71.95B | -4.44% | 0.015 |
| MRNA | Moderna Inc | S&P 500 | Healthcare | 21.39B | -9.49% | 0.011 |
| LITE | Lumentum Holdings Inc | S&P 500 | Utilities | 75.66B | -9.39% | 0.01 |
| cash | Cash | Cash | Cash | – | - | 0.005 |
As always, more trades next week!
See also
- Week 22: FLEX and VRT Join Our Momentum-Focused Portfolio (22 / 2026)
- Week 21: Buying DELL, Selling MRNA in Momentum Strategy (21 / 2026)
- Portfolio Week 19: Selling AA and TER; Buying KEYS and LITE (19 / 2026)
- 2. Momentum Ranking Week 18: New Buys in APA, VAL (18 / 2026)
- 1. Week 17 Portfolio Highlights: DOCN Acquired, LYB Position Reduced (17 / 2026)