The week’s activity resulted in 2 new trades — 2 buys and no sells.
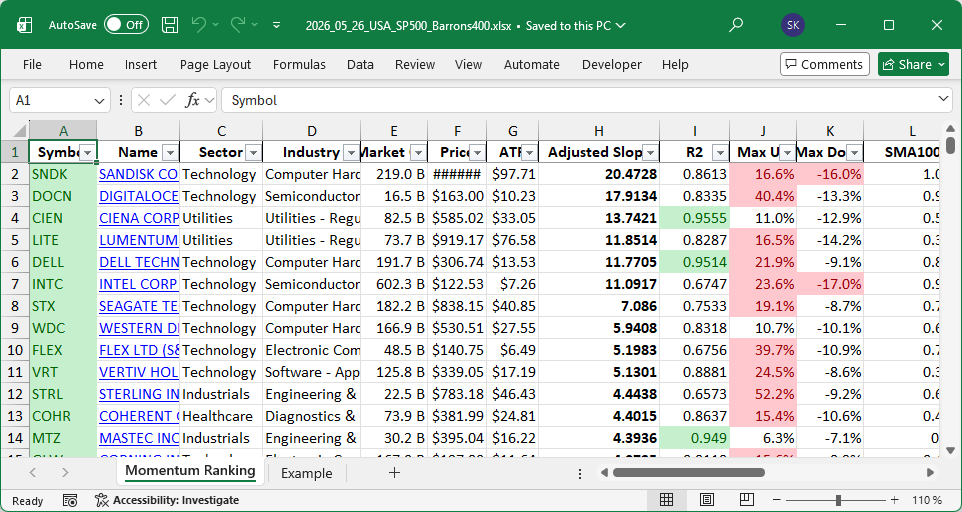
Discover the top-performing stocks of the week with our Momentum Ranking! Click here to access the latest data for week 22.
Weekly Portfolio Update: Market Highlights and Strategic Rebalancing
This week, we observed another notable movement in the markets as the S&P 500 maintained its position above the 200-day moving avreage for the 35th day in a row. This points towards a steady market regime, allowing us to continue with new buys and adjustments within our portfolio. Our cash position remains relatively low at 3.3%, indicating that we’re nearly fully invested right now.
In our latest actions, we initiated positions in two promising stocks. Flex Ltd. (FLEX), known for its electronics manufacturing services, and Vertiv Holdings Co (VRT), a provider of critical digital infrastructure solutions, have both been added to our portfolio. There were no outright sells this week, reflecting stability in our current holdings.
Rebalancing was a central focus, as we added to our existing positions in several companies. Applied Materials (AMAT), Allegheny Technologies (ATI), Chord Energy (CHRD), Comfort Systems USA (FIX), Corning (GLW), Keysight Technologies (KEYS), Lam Research (LRCX), and MasTec (MTZ) all received additional investment. Conversely, we trimmed our positions in Darling Ingredients (DAR) and Valaris (VAL) to maintain our investment strategy.
The Technology sector continues to hold its status as the top performer in our portfolio, highlighting its pivotal role as a growth driver. With companies like Keysight Technologies leading the charge, technology’s influence isn’t just dominant—it’s essential. Our top holdings currently include M/A-COM Technology Solutions Holdings (MTSI), Roivant Sciences (ROIV), and Keysight Technologies (KEYS).
In performance highlights, DELL Technologies was a standout this week, boasting a gain of 19.1%. Other top performers included TTM Technologies with a 10.5% increase and APA Corporation at 4.6%. On the flip side, MasTec experienced a drop of 12.1%, followed by Comfort Systems USA and Dow Inc. with declines of 10.4% and 7.1%, respectively. Our portfolio’s weekly return was -0.56%, underperforming the SPY, which saw a positive return of 0.58%.
Our model currently highlights promising opportunities in stocks like A, AA, AAL, AAON, and AAPL—indicating potential shifts in focus for future investments. It’s also worth noting that the AI-related trade appears to be gaining momentum again, signaling exciting opportunities on the horizon.
Feel free to share your thoughts and insights in the comments section below.
This week’s transactions:
-
Sold:
- No sells in this week!
-
Bought:
-
Rebalanced / added:
-
Rebalanced / reduced:
Index Distribution:
The S&P 500 index is currently contributing the most to our portfolio.
Current portfolio allocation:
The Technology sector now has the largest share in the portfolio:
Weekly sector distribution:
Current portfolio (@finviz):
| Symbol | Name | Index | Sector | MC | Dist to 52w High | pct |
|---|---|---|---|---|---|---|
| MTSI | MACOM Technology Solutions Holdings Inc | S&P 400 | Technology | 31.13B | 1.69% | 0.072 |
| ROIV | Roivant Sciences Ltd | S&P 400 | Healthcare | 21.43B | -9.13% | 0.059 |
| KEYS | Keysight Technologies Inc | S&P 500 | Technology | 60.53B | -4.65% | 0.057 |
| CHRD | Chord Energy Corp | S&P 400 | Energy | 7.94B | -7.12% | 0.055 |
| AMAT | Applied Materials Inc | S&P 500 | Technology | 359.31B | 0.92% | 0.049 |
| MTZ | Mastec Inc | S&P 400 | Industrials | 31.10B | -10.83% | 0.047 |
| ATI | ATI Inc | S&P 400 | Industrials | 22.74B | -2.64% | 0.047 |
| DELL | Dell Technologies Inc | S&P 500 | Technology | 199.64B | 2.57% | 0.046 |
| LRCX | Lam Research Corp | S&P 500 | Technology | 398.48B | 2.79% | 0.044 |
| VAL | Valaris Ltd | S&P 400 | Energy | 6.76B | -14.46% | 0.042 |
| APA | APA Corp | S&P 500 | Energy | 13.64B | -15.48% | 0.041 |
| MKSI | MKS Inc | S&P 400 | Technology | 22.44B | 1.67% | 0.04 |
| FIX | Comfort Systems USA Inc | S&P 500 | Consumer Cyclical | 67.00B | -8.23% | 0.038 |
| VRT | Vertiv Holdings Co | S&P 500 | Technology | 129.91B | -10.98% | 0.037 |
| CIEN | CIENA Corp | S&P 500 | Utilities | 85.01B | 0.29% | 0.036 |
| cash | Cash | Cash | Cash | – | - | 0.033 |
| GLW | Corning Inc | S&P 500 | Technology | 170.59B | -6.41% | 0.032 |
| FLEX | Flex Ltd | S&P 400 | Technology | 51.58B | -4.45% | 0.03 |
| DOCN | DigitalOcean Holdings Inc | S&P 400 | Technology | 16.75B | -3.33% | 0.029 |
| DAR | Darling Ingredients Inc | S&P 400 | Consumer Defensive | 9.45B | -9.98% | 0.028 |
| STX | Seagate Technology Holdings Plc | S&P 500 | Technology | 189.16B | 0.27% | 0.025 |
| WDC | Western Digital Corp | S&P 500 | Technology | 182.66B | 0.91% | 0.025 |
| TTMI | TTM Technologies Inc | S&P 400 | Technology | 20.30B | 1.97% | 0.024 |
| DOW | Dow Inc | S&P 500 | Basic Materials | 25.79B | -16.28% | 0.021 |
| LYB | LyondellBasell Industries NV | S&P 500 | Basic Materials | 22.66B | -16.37% | 0.017 |
| COHR | Coherent Corp | S&P 500 | Healthcare | 74.63B | -7.64% | 0.016 |
| LITE | Lumentum Holdings Inc | S&P 500 | Utilities | 72.42B | -14.26% | 0.01 |
As always, more trades next week!
See also
- Week 21: Buying DELL, Selling MRNA in Momentum Strategy (21 / 2026)
- Week 20 Highlights: DOCN Surges, APA Sinks, CHRD Added (20 / 2026)
- Portfolio Week 19: Selling AA and TER; Buying KEYS and LITE (19 / 2026)
- 2. Momentum Ranking Week 18: New Buys in APA, VAL (18 / 2026)
- 1. Week 17 Portfolio Highlights: DOCN Acquired, LYB Position Reduced (17 / 2026)