No new transactions to report this week.
Get ahead of the game with our weekly Momentum Ranking report! Click here to see the top stocks for week 12.
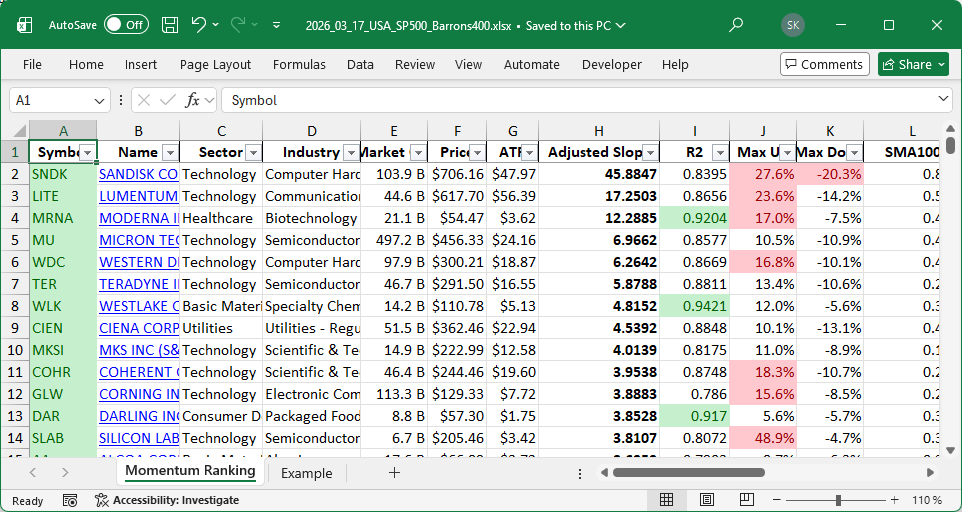
This week’s market enviroment has been quite eventful, with the S&P 500 spending 213 days just flirting above its 200-day moving average. Amid a world marked by geopolitical news, particularly concerning Iran, it seems like investors are treading cautiously. We�re almost fully invested, with only 7.7% of our portfolio in cash reserves, keeping us nimble should market conditions shift.
In the past week, there have been no trades in our portfolio. This means we neither bought new stocks nor sold existing ones. Instead, we’ve kept our strategy steady amidst the uncertain market conditions. Remember, our approach, as explained in Andreas Clenow’s ‘Stocks On The Move,� is to trade based on momentum-ranking�making moves only when market signals align perfectly.
Technology continues to be a standout sector in our holdings. Companies in this sector often provide innovation-driven growth, serving as a solid backbone in many investment strategies. Our current top holdings include cash, TER (a company in the graphically-intensive world of semiconductor equipment), and ATI, noted for its work with cutting-edge materials. Meanwhile, our best performer this week, CIEN, rose impressively by 23.69%, showing strong momentum. On the flip side, DG endured a decrease of 7.83%, proving that not all stocks share the same fortune.
As always, I’m keen to hear your thoughts on these market developments. Please feel free to share your insights or questions in the comments section below.
This week’s transactions:
-
Sold:
- No sells in this week!
-
Bought:
- No buys in this week!
-
Rebalanced / added:
- No positions were added to in this week!
-
Rebalanced / reduced:
- No positions were reduced in this week!
Index Distribution:
Right now, most of the stocks in our portfolio are from the S&P 500 category.
Current portfolio allocation:
Right now, the Technology sector is where most of our money is at.
Weekly sector distribution:
Current portfolio (@finviz):
| Symbol | Name | Index | Sector | MC | Dist to 52w High | pct |
|---|---|---|---|---|---|---|
| cash | Cash | Cash | Cash | – | - | 0.077 |
| TER | Teradyne, Inc | S&P 500 | Technology | 46.76B | -13.40% | 0.075 |
| ATI | ATI Inc | S&P 400 | Industrials | 20.47B | -11.11% | 0.072 |
| AMAT | Applied Materials Inc | S&P 500 | Technology | 279.11B | -11.18% | 0.07 |
| CIEN | CIENA Corp | S&P 500 | Utilities | 52.28B | 0.63% | 0.069 |
| ROIV | Roivant Sciences Ltd | S&P 400 | Healthcare | 20.27B | -6.61% | 0.067 |
| WDC | Western Digital Corp | S&P 500 | Technology | 105.76B | 0.66% | 0.054 |
| FIX | Comfort Systems USA, Inc | S&P 500 | Consumer Cyclical | 50.29B | -4.69% | 0.053 |
| MTSI | MACOM Technology Solutions Holdings Inc | S&P 400 | Technology | 16.67B | -14.17% | 0.051 |
| DG | Dollar General Corp | S&P 500 | Consumer Defensive | 28.80B | -17.32% | 0.051 |
| MU | Micron Technology Inc | S&P 500 | Technology | 518.98B | 1.23% | 0.05 |
| DAR | Darling Ingredients Inc | S&P 400 | Consumer Defensive | 9.07B | -0.28% | 0.049 |
| MKSI | MKS Inc | S&P 400 | Technology | 15.50B | -14.59% | 0.033 |
| ALB | Albemarle Corp | S&P 500 | Basic Materials | 19.56B | -19.42% | 0.033 |
| TTMI | TTM Technologies Inc | S&P 400 | Technology | 10.10B | -13.94% | 0.03 |
| STX | Seagate Technology Holdings Plc | S&P 500 | Technology | 91.44B | -8.81% | 0.03 |
| MRNA | Moderna Inc | S&P 500 | Healthcare | 21.30B | -9.44% | 0.027 |
| LRCX | Lam Research Corp | S&P 500 | Technology | 282.22B | -11.95% | 0.025 |
| LUV | Southwest Airlines Co | S&P 500 | Industrials | 20.14B | -25.62% | 0.022 |
| AA | Alcoa Corp | S&P 400 | Basic Materials | 17.35B | -3.84% | 0.021 |
| SATS | EchoStar Corp | S&P 400 | Communication Services | 32.62B | -14.62% | 0.017 |
| AMKR | AMKOR Technology Inc | S&P 400 | Technology | 11.44B | -18.99% | 0.013 |
| COHR | Coherent Corp | S&P 400 | Technology | 46.08B | -18.12% | 0.012 |
As always, more trades next week!
See also
- Week 22: FLEX and VRT Join Our Momentum-Focused Portfolio (22 / 2026)
- Week 21: Buying DELL, Selling MRNA in Momentum Strategy (21 / 2026)
- Week 20 Highlights: DOCN Surges, APA Sinks, CHRD Added (20 / 2026)
- Portfolio Week 19: Selling AA and TER; Buying KEYS and LITE (19 / 2026)
- 2. Momentum Ranking Week 18: New Buys in APA, VAL (18 / 2026)