Nothing exciting to report this week, we’re not making any new buys since the S&P 500 is still below its 200-day moving average.
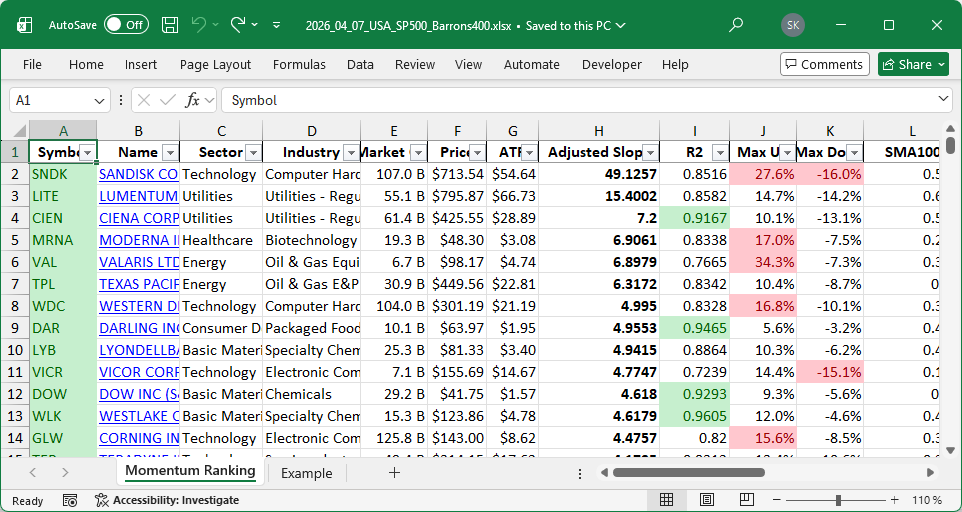
Get ahead of the game with our weekly Momentum Ranking report! Click here to see the top stocks for week 15.
This week, we’re navigating a tricky market enviroment, with the S&P 500 spending the last nine days below its 200-day moving average. When this happens, it’s crucial for us to stay level-headed and focused on protecting our portfolio. We’re in a holding pattern right now, with 21.0% of our portfolio in cash, ready to act when conditions improve.
In terms of portfolio activity, there were no new buys this week. We had to say goodbye to SATS, as it fell out of the top 20% of our universe, illustrating how dynamic our strategy can be. After a strong February, SATS experienced a decline of -5.9% in March, leading to our decision. Despite this, our portfolio is impressively still up 20% for the year so far!
Our top sector this week is Technology, which tends to play a significant role in growth-focused portfolios thanks to its innovative nature. Notable names in this sector include CIEN, known for its telecommunications equipment, and TER, a tester for semiconductor manufacturers. Our top holdings currently are cash, CIEN, and TER. This might look conservative, but with market uncertainties, holding reserves allows flexibility. On performance, AA led the pack with a gain of +23.28%, while MRNA was our weakest, dipping by -8.96%.
We’re always eager to hear from fellow investors�what’s your take on the current market or your strategies? Share your thoughts in the comments.
This week’s transactions:
-
Sold:
-
Bought:
- No buys in this week!
-
Rebalanced / added:
- No positions were added to in this week!
-
Rebalanced / reduced:
- No positions were reduced in this week!
Index Distribution:
At present, we’re mostly invested in stocks from the S&P 500 sector.
Current portfolio allocation:
The Technology sector is now the big cheese in our portfolio.
Weekly sector distribution:
Current portfolio (@finviz):
| Symbol | Name | Index | Sector | MC | Dist to 52w High | pct |
|---|---|---|---|---|---|---|
| cash | Cash | Cash | Cash | – | - | 0.21 |
| CIEN | CIENA Corp | S&P 500 | Utilities | 62.62B | -3.69% | 0.08 |
| TER | Teradyne, Inc | S&P 500 | Technology | 49.15B | -8.98% | 0.077 |
| ATI | ATI Inc | S&P 400 | Industrials | 20.04B | -12.94% | 0.071 |
| AMAT | Applied Materials Inc | S&P 500 | Technology | 275.98B | -12.17% | 0.069 |
| ROIV | Roivant Sciences Ltd | S&P 400 | Healthcare | 19.70B | -9.25% | 0.065 |
| WDC | Western Digital Corp | S&P 500 | Technology | 103.65B | -4.35% | 0.056 |
| DAR | Darling Ingredients Inc | S&P 400 | Consumer Defensive | 10.06B | -1.94% | 0.055 |
| FIX | Comfort Systems USA, Inc | S&P 500 | Consumer Cyclical | 49.73B | -5.74% | 0.053 |
| MTSI | MACOM Technology Solutions Holdings Inc | S&P 400 | Technology | 17.46B | -10.14% | 0.051 |
| MKSI | MKS Inc | S&P 400 | Technology | 15.79B | -13.03% | 0.035 |
| ALB | Albemarle Corp | S&P 500 | Basic Materials | 20.30B | -16.38% | 0.034 |
| STX | Seagate Technology Holdings Plc | S&P 500 | Technology | 100.30B | -2.19% | 0.033 |
| TTMI | TTM Technologies Inc | S&P 400 | Technology | 9.98B | -14.91% | 0.029 |
| LRCX | Lam Research Corp | S&P 500 | Technology | 274.24B | -14.44% | 0.024 |
| MRNA | Moderna Inc | S&P 500 | Healthcare | 19.38B | -17.60% | 0.024 |
| AA | Alcoa Corp | S&P 400 | Basic Materials | 19.08B | 0.09% | 0.022 |
| COHR | Coherent Corp | S&P 500 | Healthcare | 46.70B | -17.03% | 0.012 |
As always, more trades next week!
See also
- Week 22: FLEX and VRT Join Our Momentum-Focused Portfolio (22 / 2026)
- Week 21: Buying DELL, Selling MRNA in Momentum Strategy (21 / 2026)
- Week 20 Highlights: DOCN Surges, APA Sinks, CHRD Added (20 / 2026)
- Portfolio Week 19: Selling AA and TER; Buying KEYS and LITE (19 / 2026)
- 2. Momentum Ranking Week 18: New Buys in APA, VAL (18 / 2026)